Thursday, September 10, 2015

Foray into Solar

For the past week or so, I've been playing around with a solar system to get better educated about solar power.  Claudia (my wife) would say the operative word is "playing".

Reading specs and literature about solar systems, it's hard to get a feel for things.  There's a lot more to it than just hooking up solar panels, and voila!, you've got electricity.  It's necessary to get your hands on actual hardware (and live wires) to get a real sense of what goes on.

In upcoming posts, I'll ramble on about what I've discovered.  I use the word "discover" loosely.

===========

First an update on the dehumidifiers:

Finally I have valid data from the "good" unit in the "damp" location:

6.05 kWh over 25.09 hours, or pro-rated over 24 hours: 5.79 kWh.

The "bad" unit used over 11 kWh over about 24 hours in the same location.  Clearly there's something wrong with it. Today it gets replaced.

===========

Back to the solar experimentation.

My set-up is the standard Harbor Freight "45 watt" kit:


The kit includes three "15 watt" panels, a charge controller (the aluminum box), two 12 volt compact fluorescent light bulbs and assorted wires for connecting things up.

As solar systems go, this one is really tiny.  The systems you see on people's roofs are claimed to generate 4000 W or so.  Mine is only 1% of so of such systems.   It turns out it would have been a bad idea to have me do any sort of backyard lab experiments with anything much bigger, so a 1% system was a good thing.

What I quickly discovered is that the solar business is laden with deception.  You might think that with this kit I'd be able to set it up, and voila!, I've got 45 W of free power on sunny days.  But you'd be wrong.

No one mentions when you buy the kit that it's not complete -- you need at least one 12 volt battery to make the thing work.  Why?  (interpreted either as "Why don't they tell you?" or "Why do you need a battery?")

The answer to the first 'why' is because this keeps the price of the kit down.  Once you own the kit, you'll probably come back for a battery, all while still thinking that the kit was a great deal.

The answer to the second 'why' is that the voltage and current coming from the solar panels is all over the place.  Even with steady sunlight, I've watched (using one of any number of multi-meters, some of which no longer work) the voltage rapidly skitter over a range of  13 and 18 volts. To power most things, you need something with a pretty steady voltage and dependable current -- like a battery. Then it becomes clear what the scheme is -- the charge controller is an intermediary between the highly-unsteady solar panels and the highly-steady ... battery.  The battery that no one at the store mentions you will need.

So this was about the first thing I learned about solar systems.  It's not just panels.  It is panels and batteries or some energy reservoir that can hold the energy that the panels collect and feed the energy back out in a calm fashion.  In the popular roof-top systems that are connected to the grid, the energy reservoir is the grid itself.  For off-grid systems that can power a house, the reservoir usually consists of a disturbing number of batteries (that can produce a really disturbing amount of current; more on my adventures with current in a future post).  It would be good when you are buying a Harbor Freight kit that they tell you that you will also need a battery (it turns out there is no such thing as "a battery" either; more on that in yet another post).

It turns out I have one of these that has a 12 V battery inside, so I was able to complete my solar system without any further purchases:


Starting with this lack of mention of batteries, I got the nagging feeling that there is a lot the solar industry doesn't want you to know until you own the panels.  Tomorrow I'll go into what "45 watt kit" really means.


Wednesday, September 9, 2015

Dehumidifier Report

Despite some issues with experimental procedure (again), there is some data to report on the dehumidifiers.

The unit that is suspected to be bad (i.e., the one that used 11 + kWh in one 24 hour period in the damper location by the cat litter) appears to be, in fact, faulty.  Over a 24 hour period, it used 5.8 kWh in the "dry" location (the music room), where the other unit had used only 3.5 kWh.  It appears it is time to replace this unit.

The "good" unit (now by the cat litter) produced invalid data.  The condensation is supposed to be carried away by a hose that runs to one of the sump pump wells.  The hose connection inside the unit appears to leak, dripping the condensation into the internal reservoir in the dehumidifier.  When the reservoir becomes full (and requires manual emptying), the dehumidifier stops running.  Thus the Kill-A-Watt reading for this unit (2.8 kWh over 24 hours) is clearly incorrect. Today I'll fix the drip and try again.

Even the good unit uses a lot of energy relative to the rest of the devices in our house.  Let's say the good unit and a new unit each use 3.5+ kWh per day.  7+ kWh per day translates to 15%+ of our electricity use during the warm months, and accounts for about a half ton of CO2 released into the atmosphere each year.

Might it be possible to run the dehumidifiers off a renewable source?  This question had occurred to me, so -- to this end -- I've decided to get a better understanding of solar power.  Tomorrow I'll report on my solar education so far.  Much of it involves blown fuses.


Tuesday, September 8, 2015

Dehumidifier Delay, A Stern Lecture

The report on the switched dehumidifiers needs to be delayed due to some "experimental procedure issues".  Hopefully tomorrow.

=============

In the meantime, something a bit more theoretical.  Or not.


"...the dumbest experiment in history, by far."  -- Elon Musk

Elon Musk is not talking about my Kill-A-Watt project.  He's talking about extracting fossil fuels that have been buried for millions of years and burning them in the space of a few hundred years.

The following elaborates on Elon's sentiment.

According to the fossil record, anatomically-modern humans have been around for about 200,000 years.  They've had some times when the climate was sort of like ours, and other times when it was a lot colder.  They, no doubt, were well aware of the temperature, especially when it was cold -- or in the case of the Mayans, for example -- when it got really hot and dry.

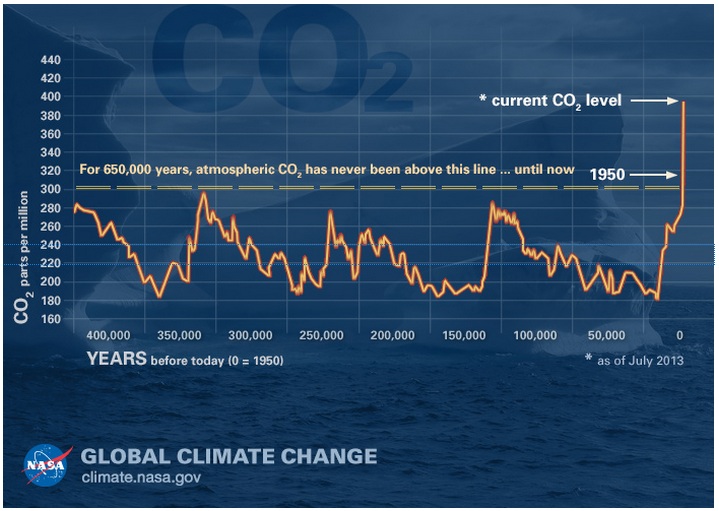
What was less obvious to anatomically-modern humans over this 200,000 years was that the carbon dioxide (CO2) level in the atmosphere went up and down.  Specifically, CO2 ranged from about 180 parts per million (ppm) up to 300 ppm, but no higher.  NASA produced this really nice graph to show what CO2 has been doing over the past 400,000 years (note that anatomically-modern humans have been around only for 200,000):


Atmospheric carbon dioxide levels over the past 400,000 years.  Source: http://climate.nasa.gov/climate_resources/24/

Apparently, this CO2 fluctuation has been going on for at least 600,000 years.  The graph shows only the most recent 400,000 or so years.

NASA got this data from scientists measuring CO2 in air bubbles frozen into Antarctic ice in Vostok, Antarctica.

A scientist measuring CO2 in a Vostok, Antarctica ice core sample.

What's carbon dioxide got to do with anything?  Check out this graph.  The green graph is CO2 variation over time  (the same graph as the NASA one above), while the blue graph is temperature variation.

Notice anything?

"Vostok Petit data" by Vostok-ice-core-petit.png: NOAA derivative work: Autopilot (talk)
Vostok-ice-core-petit.png. Licensed under CC BY-SA 3.0 via Commons https://en.wikipedia.org/wiki/Ice_core#/media/File:Vostok_Petit_data.svg


It doesn't take a Vostok ice scientist to notice that the green and blue graphs are very similar.  Now the questions are:

(1) Is this a coincidence?

(2) If not, does a warmer climate mean more CO2 in the atmosphere?

(3) Or if not, does more CO2 in the atmosphere mean warmer climate?

Both #2 and #3 seem to be true.  The story appears to be pretty complicated, involving something called Milankovitch cycles.  An explanation of these cycles and how they affect temperature and CO2 levels is more complicated than I really want to go into in this blog post.  Suffice it to say that the Milankovitch cycles appear to get warming started, which releases CO2 from the oceans.  The increased level of CO2 kicks in the well-known greenhouse effect that pushes up the temperature (https://en.wikipedia.org/wiki/Greenhouse_effect). For various reasons, temperature eventually peaks and starts to fall, causing CO2 to be absorbed back into the oceans.  As the CO2 level falls, less solar energy is trapped, and temperature falls.  Temperature and CO2 decline into a valley, at which point the Milankovitch cycle comes by and kicks off another round of warming.

Note that there is still no conclusive explanation for glacial cycles, with a lot of scientists still working on the question.  If you want to know more about the current state of research on the matter, Google "explain glacial cycles".

The valleys on the CO2 and temperature graphs are called "glacial periods" and the peaks have the highly-imaginative name of "interglacial period".

Over the 200,000 years anatomically-correct humans have been around, there have been some glacial periods, like the one that ended about 10,000 years ago.  This glacial period actually lasted from 110,000 years ago to 12,000 years ago (https://en.wikipedia.org/wiki/Last_glacial_period).  That must have been a long 100,000 years.

Take a moment and look at our temperature and CO2 graphs -- exactly during this 100,000 years, the Vostok ice cores say that temperature just kept getting colder and colder.  The Vostok data seems to be consistent with geologic data.

Also note that when we anatomically-modern humans first showed up, temperature was on a decline. This kind of sucked -- just when we show up, times start to get more and more difficult.  There were the lucky ducks at around 125,000 years ago who had nice weather, but for a lot of the rest of the 200,000 years, it's been rather wintery, at least in the high latitudes.

Also note that WE -- present-day anatomically-correct humans -- are riding a peak!  That means we're among the lucky ducks to have a nice, warm climate (tell that the Vostok scientists whose teeth are chattering, eh?).

But we anatomically-correct humans couldn't leave well enough alone...

Go back to the NASA graph (the first one).  Notice what's going on in the graph at the very right. Here's the graph again so you don't need to scroll:


Atmospheric carbon dioxide levels over the past 400,000 years.
Notice the sudden rise in CO2 at the very right.


Something funny happened starting around 1950.  CO2 (which hadn't been above 300 ppm for 600,000 years) suddenly goes straight up from 300 ppm to 400 ppm.  Is this nature just messing with us?

Most likely not.  It might have something to do with this:


World Energy Consumption in Terpinkajillanjoules per year by anatomically-correct humans.
Source: http://ourfiniteworld.com/2012/03/12/world-energy-consumption-since-1820-in-charts/

Notice something funny?  Once again, even the most frozen Vostok ice scientist would point out that the colored part of the World Energy Consumption graph above starts to get real fat and streak upward at about 1950.  Hmmm...

Let's see. CO2 started going up dramatically around 1950. We started burning lots of fossil fuel around 1950.  Burning fossil fuel produces lots of CO2 (one gallon of gas -- which weighs about 6 lbs -- produces about 19 lbs of CO2 when burned; think of that each time you drive).  Rising CO2 increases temperature.  Uh oh...

Well, the temperature hasn't gone up (at least that much), which is why Elon Musk calls it an "experiment".  Still, there's already enough data showing that temperature is rising, and I wouldn't bet against Elon.

Temperature change over the last 135 years.  To see an entertaining animated GIF version, click on


So, what's the problem?  Warm is good, no?  Don't we like nice summery weather?

Actually, there are several problems.  Some of them are:

(1) The climate gets hotter and drier.  Ask the Mayans (or for that matter Californians) about this.

(2) Higher temperature means more energy in the atmosphere means more vigorous weather.  This means that storms like Superstorm Sandy and Mega-Blizzards are more likely.  Kind of counter-intuitive that higher temperatures would mean more snow.  Maybe Jim "Snowball" Inhofe can explain.

(3) Higher temperature means melting ice and expanded ocean water, both leading to rising sea levels.  Eventually we could end up with a coast line that looks like this:


US shoreline resulting from rising ocean levels.
Source: http://ngm.nationalgeographic.com/2013/09/rising-seas/if-ice-melted-map

Florida is completely underwater, as is Long Island, Cape Cod, Boston, most of New York City, much of New Jersey. Then there's the whole Gulf of Mexico coast.  Forget New Orleans -- no levee will hold back the water at this point.  And California looks kind of funny also, with its waterfront properties in the Sierras.

Some people would say "good riddance" until they realize that the people who lived in the now-underwater places would like to share your space, food, water.  Could get ugly.  Ask the Mayans.

So, to wrap this up, what to do?  Maybe it's already too late.  We've put the CO2 into the atmosphere, we can't get it out, and temperature is going to rise no matter what.  Hopefully that's the worst case.

Others are more optimistic.  They point out that trees and oceans could become our best friends, rapidly photosynthesizing and absorbing the excess CO2 out of the air, while we anatomically-correct humans get our act together and stop putting more excessive CO2 into the air.

I'm more or less with the optimists, but the realist part of me knows that limiting CO2 release to a sustainable level is much easier said than done because there's a lot of easy money in putting CO2 into the air.  This makes me suspect that we will end up burning pretty much all the fossil fuel we can find, while hoping and believing that all the extra CO2 won't increase temperature that much.

If we're wrong, then in a century or so, the ghost of Elon Musk may be back to say, "I told you so."


Monday, September 7, 2015

The Coffee Maker, and Some Follow-Up

Briefly, our coffee maker (Proctor Silex 48521, i.e., the cheap plastic one with just the on-off button)
used 100 Wh (0.1 kWh) to make one pot, with an additional 20 Wh to run the warming plate for 20 minutes. When brewing, the power draw is 950 W.

What does this mean?  At $.20 / kWh, the cost of the electricity to make a pot of coffee and keep it warm for twenty minutes is about $0.02.  CO2-wise -- about two ounces.

===========

Follow-up promised in earlier posts:

Follow-up #1: Charging the Nissan Leaf:  As our Nissan Leaf charges at home, the Kill-A-Watt
reports that our "Level 1" system draws 1350 W (1.350 kW).  Typically a recharge puts between 10 to 15 kWh into the car, which means that the charging process runs for 7.5 to 11 hours.  The cost per charge is then $2-$3, not bad for the fuel cost of a commute of 50-75 miles.  CO2-wise, a charge results in a release of 15-25 lbs, less if you charge with power from a renewable source.  To go the same distance range with an internal combustion engine vehicle (ICEV) that gets 25mpg, the CO2 release is 40-60 lbs, while the gasoline costs $5-$8.

The charge time is something you might think you have to get used to as an electric vehicle (EV) owner.  Actually it's not.  What you need to adopt is a new paradigm about parking.  Parking no longer means just locking and leaving your car.  It now means locking and leaving your car *after plugging it in*.  For example, I now typically grocery shop at the Wayland Center Stop'n'Shop because they have 10 FREE Level 2 charging stations.  Level 2 adds about 3.5 kWh per hour, or about 15-20 miles of range per hour, depending on how aggressively you drive.  While I'm in the store for 30 minutes, the car gets nearly 2 kWh (8-10 miles) of free fuel.  It costs the store about $.40.


Three cars in the free charging location at the Wayland Center Stop'n'Shop.  Apparently electric models made by Honda, Caddilac and Mercedes-Benz (snark, snark).


The catch is that your destinations need to have charging stations.  Presently most destinations do not.  OK, it's a brave new world for now. However, there are fast charging stations at most malls and Nissan dealers in the Boston MetroWest area.  A fast charger is something to behold, pouring in 10 kWh in 15 minutes (10-12x faster than a Level 2 charger).  In most cases, on any given trip, you pass by one of the fast charger locations.  There's even a web site and an app from http://plugshare.com that show you where they are, along with some information about the current status (the voltage status, too, ha ha).  Also, the Leaf will navigate you to a charging station, whether or not you purchased the built-in GPS option.

Charging stations in the Boston area shown on the http://plugshare.com web site. Click on the image to see a larger version.


Another great charging destination: Maynard center.  With the Fine Arts Theatre, along with
"fine dining" establishments like Babico's and quite a number of others, there are lots of reasons to go to Maynard Center. While you're there, you can plug into one of two charging stations the town provides for free.  They're just across from the theatre.


One of the disappointing destinations is West Concord. Like Maynard, West Concord has quite
 a number of good lunch places (including a place with great fish sandwiches), and it has two charging stations.  Unfortunately these charging stations have not worked in months.  They belong to Concord Light (the local power utility), so a call to their engineering department (978-318-3101) might help get these charging stations back in service.


===============

Follow-up #2:  The basement dehumidifiers have been swapped.  At first glance, it seems that the unit that was by the cat litter has gone bad.  It runs nearly incessantly, makes a grinding noise, and draws 500W while doing its thing.  The other unit barely comes on (even in the suspected humid location in the basement), although it draws 750W while running.  Full report tomorrow.

===============

Guest posts: There has been interest among others who secretly own Kill-A-Watts to contribute to this blog.  The blog management has graciously accepted their offers.  Look for posts by guest contributors in coming days.


Sunday, September 6, 2015

The Entertainment Center Urban Legend

Urban legend and some more reliable sources (1, 2) claim that entertainment centers -- in particular your cable box -- rob you as you sleep.  In other words, a cable box allegedly uses a significant amount of electricity even when it is not on.  In this post, I report my Kill-A-Watt measurements for our entertainment center and attempt to prove or disprove this urban legend.

Three scenarios were measured: (1) cable box on, TV off, (2) cable box on, TV on, and (3) both cable box and TV off.  The results were somewhat surprising.

Note that there are devices other than the cable box and TV on the circuit monitored by the Kill-A-Watt, which complicated the analysis. The total collection of equipment is:

(1) the Comcast cable box

(2) an LG 42" LED TV (rated at 205W)

(3) a SONY AV Receiver (rated at 200W!)

(4) a SAMSUMG Blu-ray player / Netflix box (rated at 17W)

(5) Yamaha speakers (rated at 42W)

(6) a Motorola cable modem (rated at 9W)

(7) a Linksys router (measured to consume 2.5W)

(8) a MyBookLive network drive (rated at 10W)

(9) a Centech antenna signal booster (rated at 2.4W)

(10) a Toshiba laptop charger (measured to consume less than 0.1W when not plugged into a laptop)

These devices are plugged into an APS uninteruptible power supply (UPS) that probably consumes a bit of power itself.

Given all these devices running off of one source, it seemed it would be difficult to conclusively paint the cable box as an energy hog.  It turns out that it was possible, however, to do just that.

============

In scenario 1 (cable box on, TV off), the entire electricity usage was measured to be 0.3 kWh over 6 hours, or 50Wh per hour.  Given that the modem, router, network drive, antenna booster and laptop charger collectively account for 25W, the cable box, at most uses 25W.  This assumes that the speakers, TV, AV receiver and Blu-ray player use no power when off, which is a questionable assumption since three of the four devices have illuminated lights even when they are "off".  Let's give these devices 10W, leaving the cable box 15W.  

Under this assumption, the cable box would consume 15 Wh x 24 hours, or 360 Wh a.k.a. .36 kWh.  To put this in perspective, of the 40-50 kWh we consume every day in the summer, the cable box allegedly accounts for .36 of those 40-50 kWh, or .72%-.9% of our energy use.  Translating to $: at $0.20/kWh, over a 30 day month, this energy use corresponds to a cost of about $2 / month for no actual utility to us, the equivalent of ceremonially burning one twenty dollar bill and one five dollar bill every December 31.

OK, so you are probably wondering why I didn't monitor just the cable box power usage to begin with.  The reasons are: (a) I wanted to know what the entertainment center as a whole was consuming, (b) it was much simpler to locate the UPS power cord vs the cable box power cord that is all part of a tangled mess, (c) it didn't occur to me until I was writing the paragraphs above.  Anyhow, I'll now go measure the real-time consumption of the cable box both in on and off states.  Be right back...

===========

The direct real-time measurements of the cable box: 13W when on, and !!8.5W!! when off.  A good question is what the cable box is doing with those 8.5W while it is allegedly "off", but I digress.

===========

So even if we never watch cable for days on end, with the cable box **off**, we're still paying 8.5W x 24 hours x $0.20/kWh / 1000 (W to kW) = $0.04 every day.  Sounds like I'm a miser, but over 365 days, that comes out to about $15 per year.  That's with the cable box OFF.  And we don't fastidiously turn it off.

Here's probably the more egregious offense for leaving the cable box plugged in, even in an off state: the CO2 generated.  The US Energy Information Administration (EIA) reports that one kWh of electricity results in at least 1.2-2.0 lbs of CO2 dumped into the atmosphere.  In the off state, the cable box still uses 8.5W x 24 hrs x 365 days / 1000 = about 75 kWh, or about 100+ lbs of CO2 dumped needlessly into the air.  Now keep in mind that there are some 321 MILLION cable boxes in the US alone!  All dumping at least 100 lbs of CO2 into the atmosphere each year.  

Yet another perspective: burning 5 gallons of gasoline produces about 100 lbs of CO2.  A useful fact to be used in a future post.

===========

OK, let's move on to the scenarios with the TV on, and then with both the cable box and TV off.

Scenario 2, cable box and TV on: 1.34 kWh over six hours, or .22 kWh per hour.  The TV, rated at 205W, seems to use much less, considering that the 200W AV Receiver and the 42W Yamaha speakers are also contributing to the total power consumption.  To put things in perspective, the LED TV uses less than the equivalent of two 100W incandescent light bulbs.  I'd say that I'm impressed and surprised that it takes apparently far less than 200W to light up nearly one side of a 42" diagonal rectangular electronic device.  This goes to show how instrumental LED technology has been for reducing energy consumption.

Lastly, for scenario 3, cable box and TV both off: 0.4 over 8 hours, or 50 Wh per hour.  Similar to cable box on, TV off.  This squares with the finding that the cable box uses only 4.5W more when on than when it is off.  In other words, there should not be much difference in consumption between scenarios 1 and 3.

===========

The bottom line conclusion: The urban legend of the cable box energy hog is more or less confirmed. By unplugging the cable box, the TV, the AV receiver, the Yamaha speakers, the Blu-ray player and the antenna booster (leaving on only the modem, router, network drive, and laptop charger) when the entertainment center is not being used, we'll have cash to spare for a money-burning ceremony at the end of the year.  Better yet, we avoid needlessly putting 100+ lbs of CO2 into the atmosphere each year.


Saturday, September 5, 2015

Dehumidifier Shocker!

The Kill-A-Watts monitored the two basement dehumidifiers -- one in the music room, and one by the cat litter.

The music room unit used about the same as previously measured -- about 3.5 kWh over 24 hours.  The cat litter unit, meanwhile, used !!11.85!! kWh.

To put this in perspective: During the summer, we use about 40-50 kWh per day total (which is already a lot for a house of our size).  Of these 40-50 kWh, the cat litter dehumidifier appears to account for more than 10 kWh!

Another way to look at it.  Our Nissan Leaf EV goes about 5 miles on one kWh.  10+ kWh enables
the Leaf to go 50+ miles.  Often the Leaf is driven less than 50 miles per day.  This means that charging the Leaf typically consumes less electricity than running the cat litter dehumidifier.  This will be verified when I monitor the Leaf charging.

To put it yet another way -- the cat litter dehumidifier appears to account for (estimating generously in favor of the dehumidifier) one-fifth of our summer electricity use.  The typical electricity bill in the summer is about $250.  Therefore, this one dehumidifier costs $50 per month from about May to September.

BTW, why is there a difference between the two dehumidifiers?  Here's my theory: the cat litter unit is in an area surrounded by bare concrete walls toward the back of the house where the ground is relatively wet, while the music room unit is in an area with finished walls toward the front of the house where the ground is clearly very dry.  Additionally, the cat litter unit is located by the two sump pump wells, but I doubt they contribute much humidity, however.  As Claudia cleverly suggested, we will swap the two units to determine whether the usage difference is caused by a difference in units, or a difference in humidity in each location.

Friday, September 4, 2015

First measurements

The first measurements made with the Kill-A-Watts:

Keurig coffee maker: 0.03 kWh per cup from cold start.  OK, this is not an earth-shattering amount of energy.  I'll do more tests to see if cups in quick succession require the same amount of energy per cup.

Bedroom a/c (Kenmore 6000 BTU/hr, 560W): 3.86 kWh overnight.  Let's say 8 hours x .560 kW = 4.5 kWh, so the rating is a bit higher than the actual power used.

Music room dehumidifier (LG 600W): 4.01 kWh over 18 hours with a goal of 35% humidity.  It will be interesting to map this usage over an entire summer as the humidity changes.

Retesting both the music room and cat litter dehumidifiers for a 24 hour period starting at 8:45am on 9/4/2015.  Results to be reported tomorrow.

Welcome

This blog is a running commentary on my project to get a sense of what uses how much electricity in our house.

I recently acquired two Kill-A-Watts, devices that report cumulative power use of plugged in 120v
devices.  Among the items to be monitored are the a/c units, the dehumidifiers, coffee makers, charging stations and the entertainment center.

Since I have only two Kill-A-Watts, these measurements will be taken on a rotating series basis.